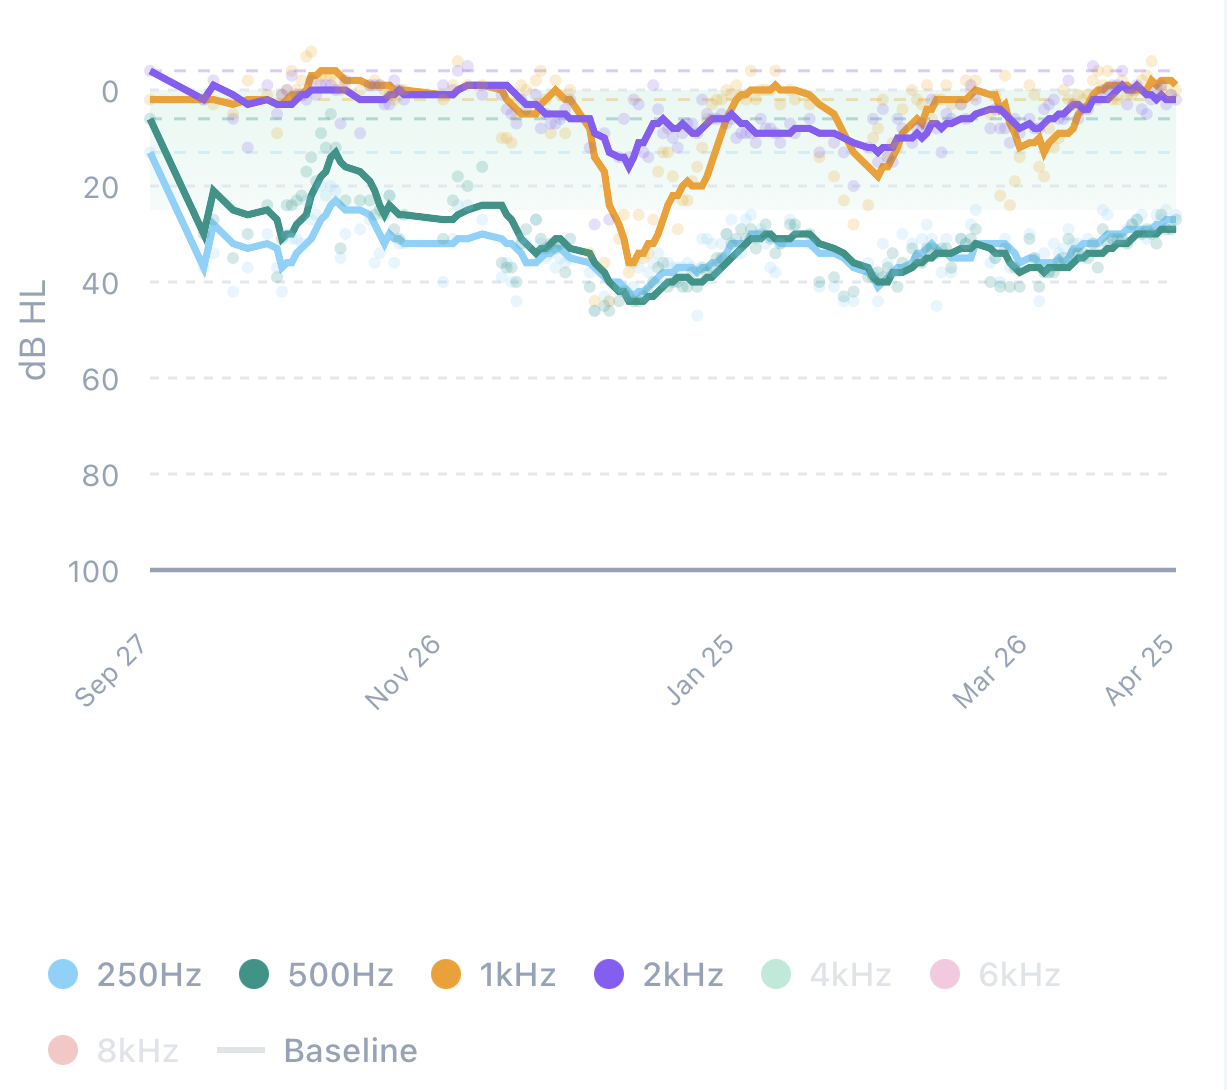
7 months of daily home audiograms. The December crisis, the treatment response, the gradual recovery — visible in one chart. Your ENT sees a snapshot every 3–6 months. Vestia sees the whole story.
iOS BETA — NOW OPEN
The hearing data your ENT has never seen
Vestia tracks your hearing every day — not just when you're in the consulting room.
Built by Dave, a patient with cochlear hydrops. I couldn't find a tool that took this condition seriously, so I made one.
- Your pattern, not a population average Every Ménière's and hydrops patient is different. Vestia learns your personal baseline and tracks what's normal for you — so meaningful changes don't get lost in the noise.
- A proper report for your ENT Not a screenshot. A multi-page clinical document with your hearing trends, medication timeline, episode events and trajectory classification — formatted the way your ENT expects to read it. Bring it to your next appointment.
- Free during beta No payment details, no trial limit. The beta is free while we validate the product with patients and clinicians. When we eventually charge, beta users will get advance notice and the option to continue free.
You're on the list. We'll be in touch within 48 hours with your TestFlight link and a short onboarding note.
Your data stays yours. Export anytime. We don't sell anything to anyone.
Free during beta · TestFlight beta capacity managed by Apple